Research Data Visualizations
Time series analysis from conservation agriculture field experiments
Calibration & Validation Data
📊 Field Observations: Measured data from experiments comparing conventional tillage (CT) vs. reduced tillage (RT) with chemical fertilizer (C), mulch (M), and organic amendments (O).
Soil Organic Carbon (SOC)
n=48Changes in soil carbon content over time across different treatments
CO₂ Emissions
n=48Carbon dioxide flux measurements from soil respiration
CH₄ (Methane) Emissions
n=48Methane emissions from different soil management practices

Volumetric Soil Water Content (VSWC)
n=48Soil moisture levels throughout the growing season
N₂O Flux
n=48Nitrous oxide emissions as an indicator of nitrogen cycling
Available Soil Nitrogen
n=48Plant-available nitrogen in the soil profile
Crop Yield Proxy
n=48Yield indicators and biomass production
DayCent Model Calibration

Residual Analysis
Statistical validation of the DayCent model calibration showing observed vs. predicted values and residual distributions.
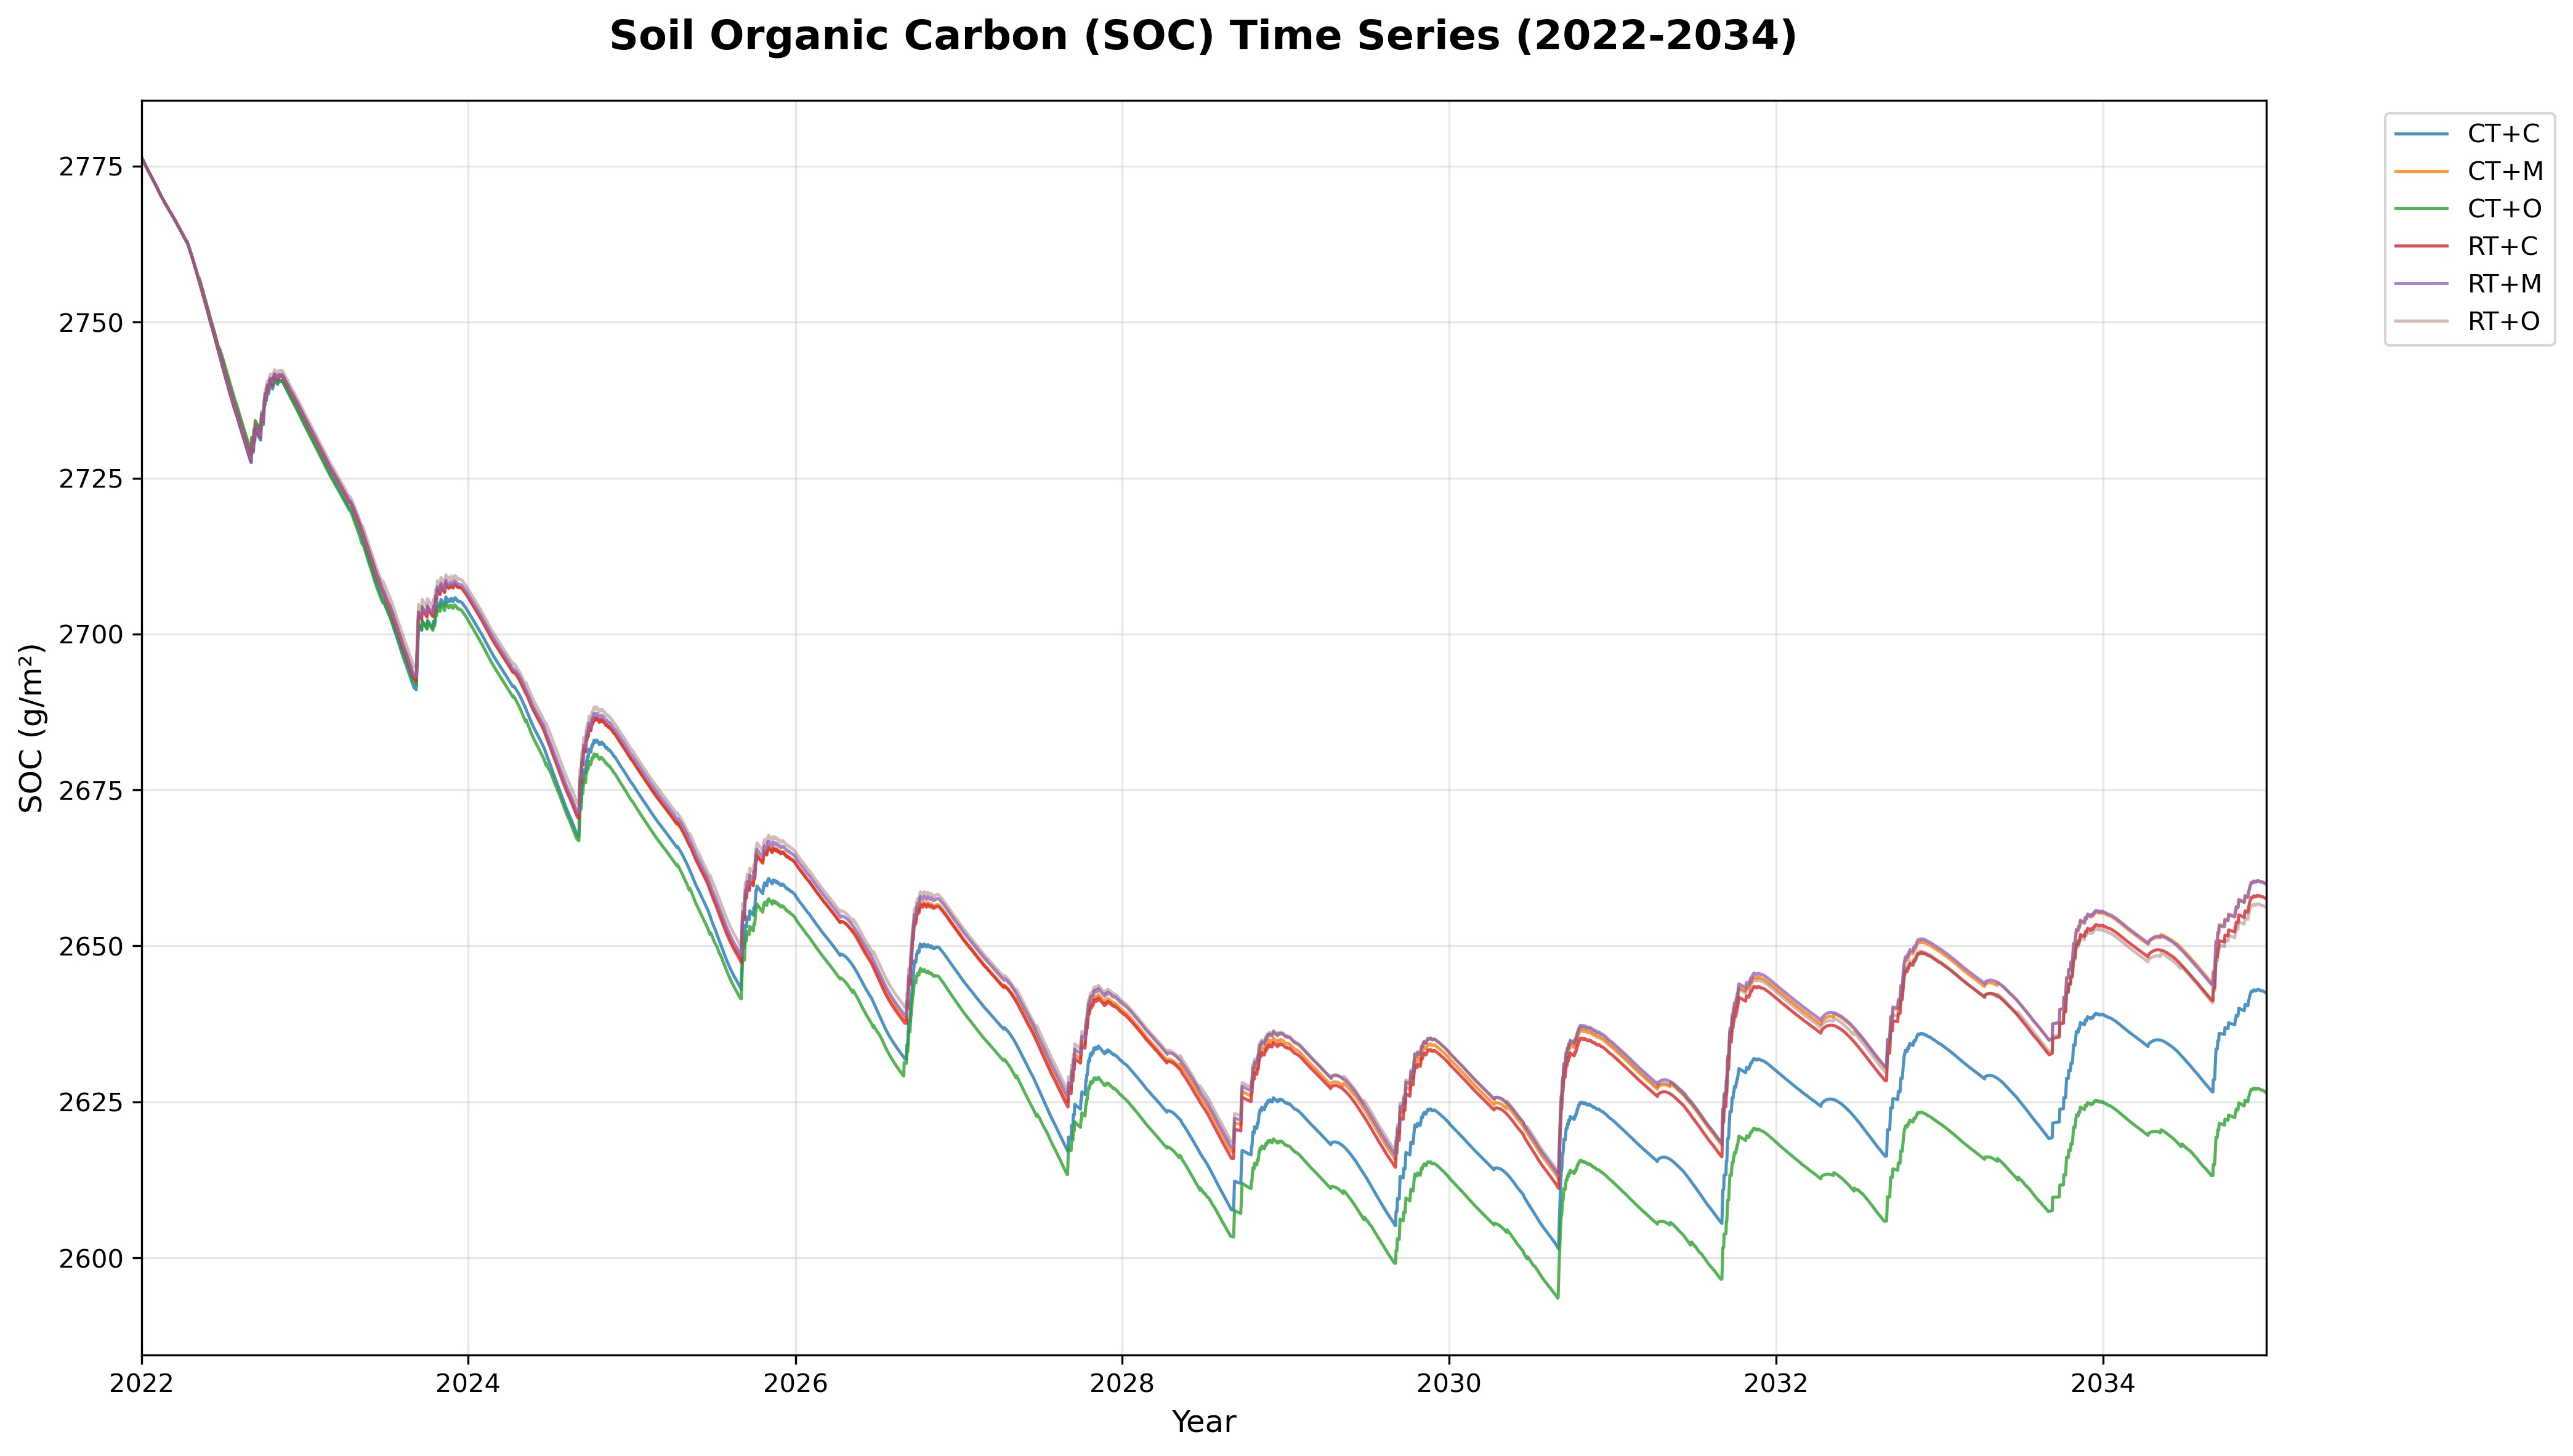
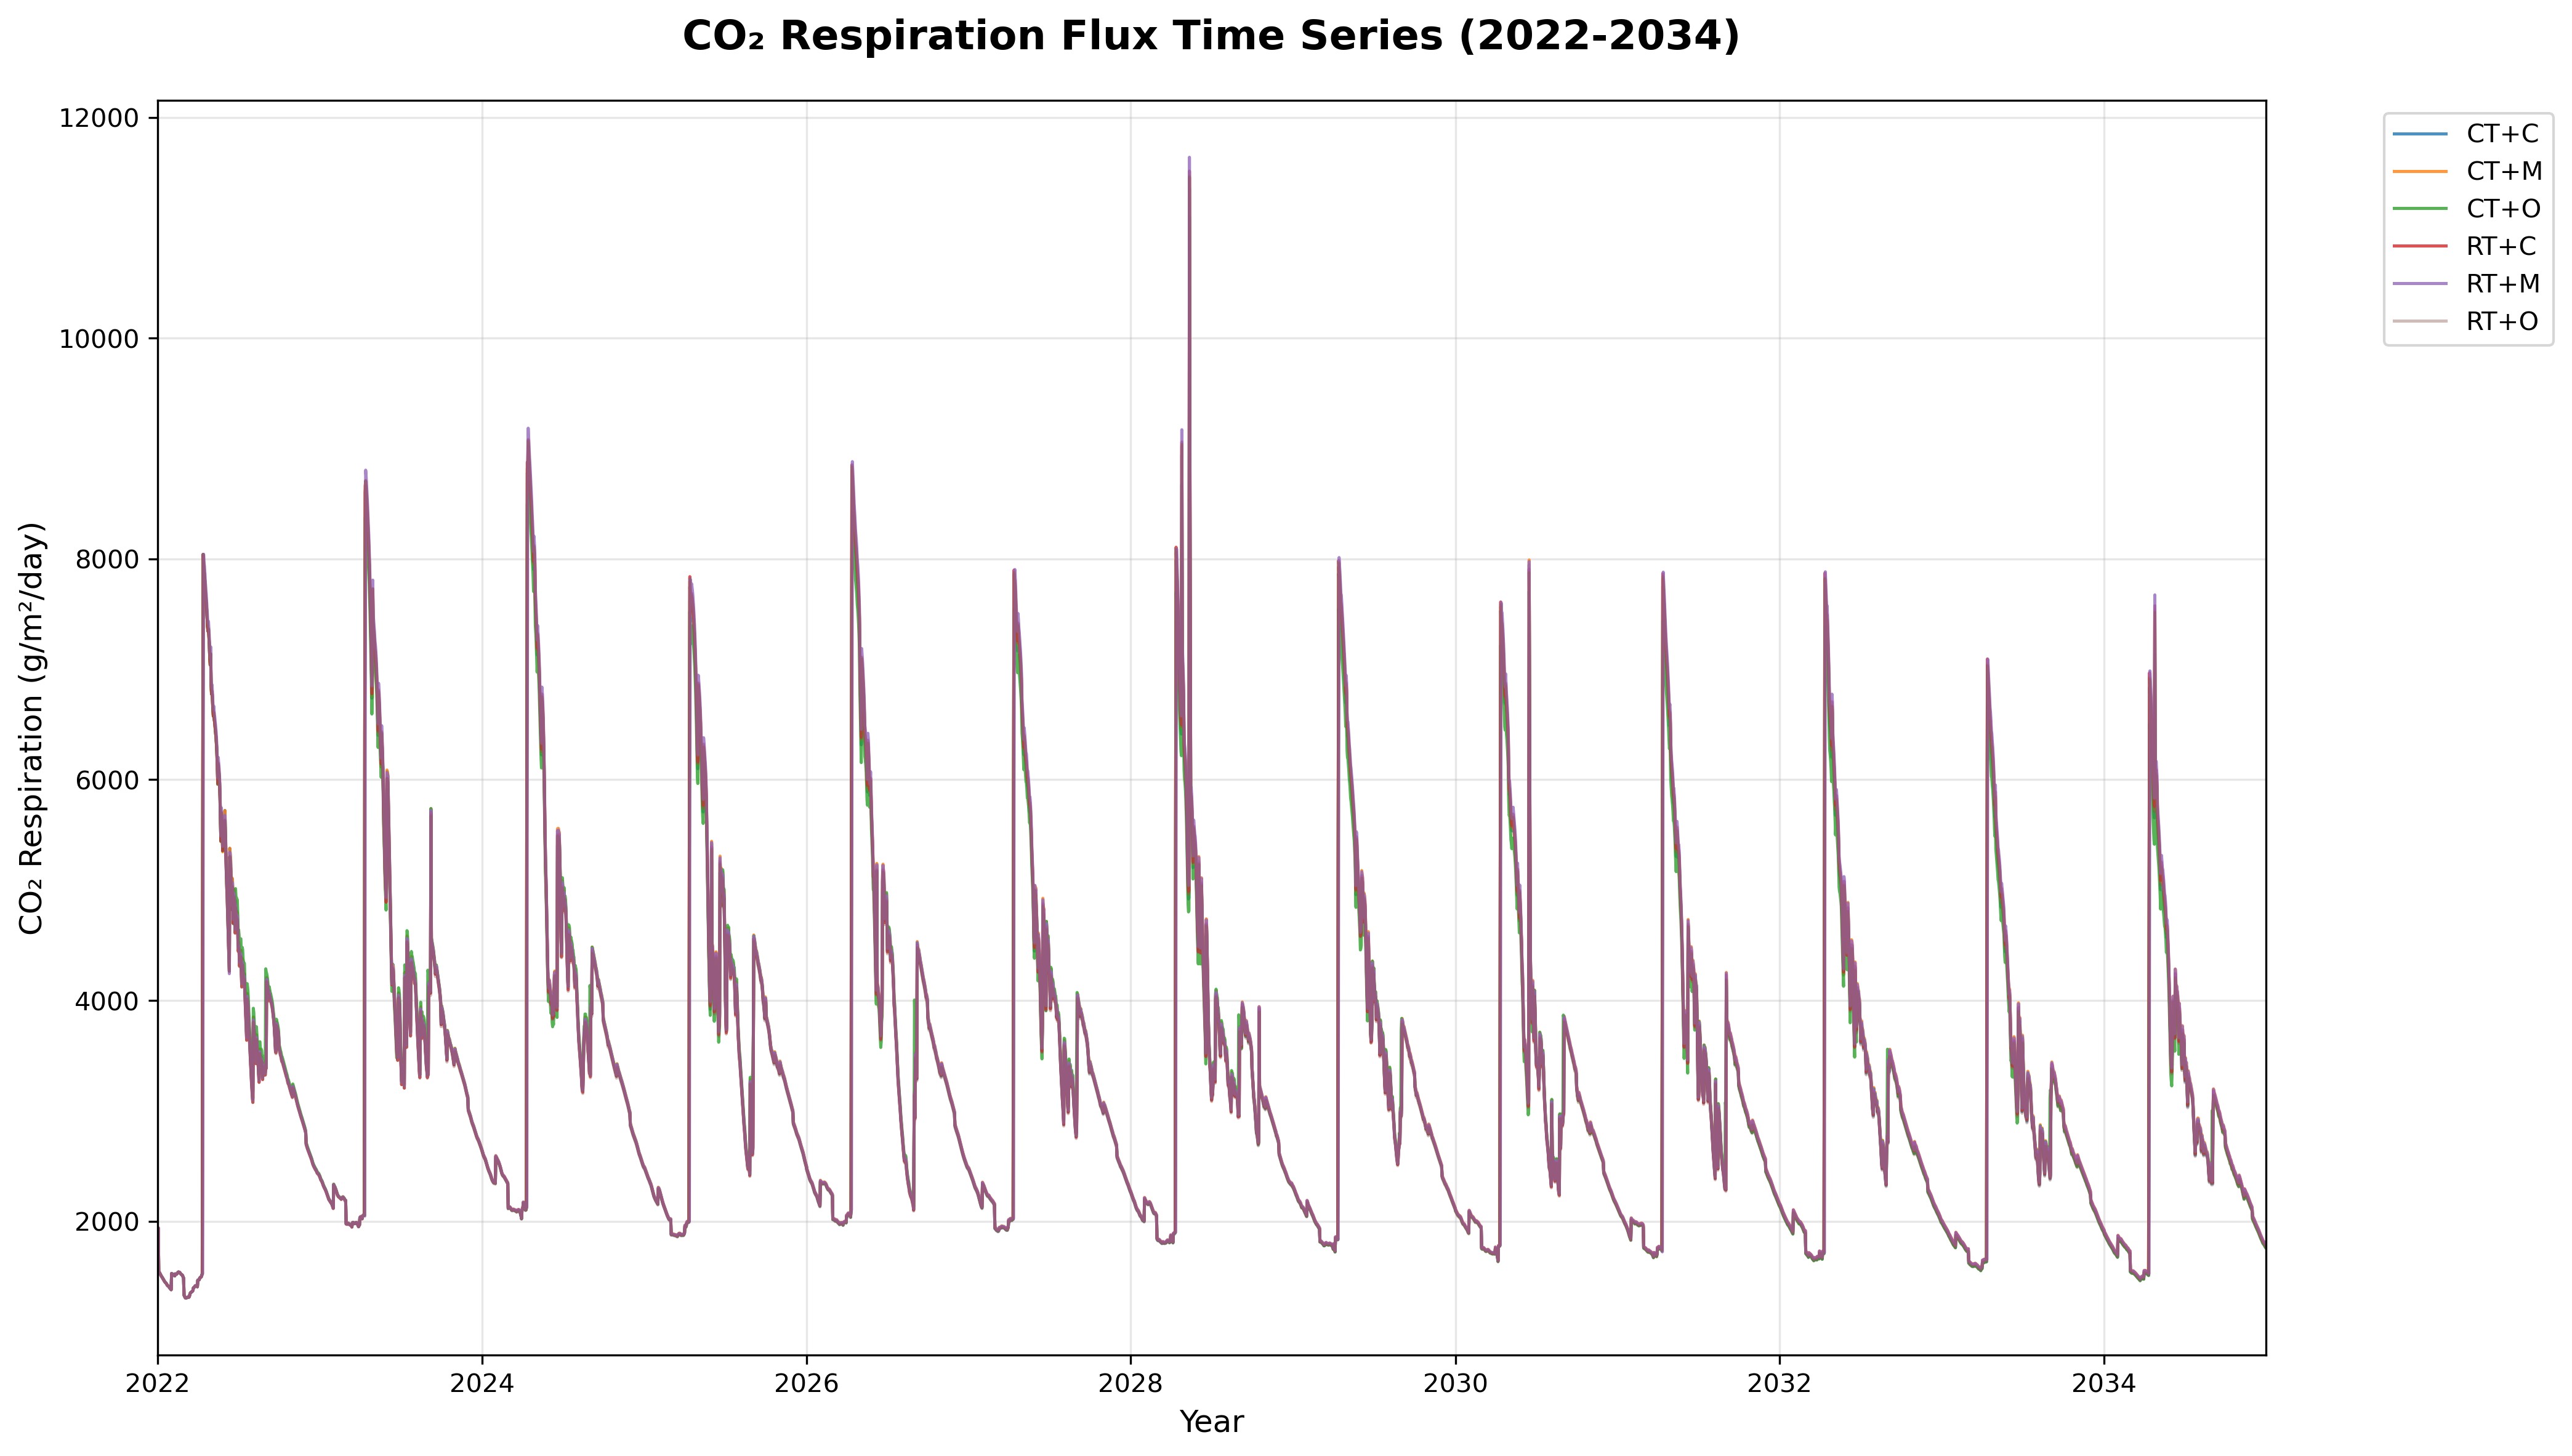
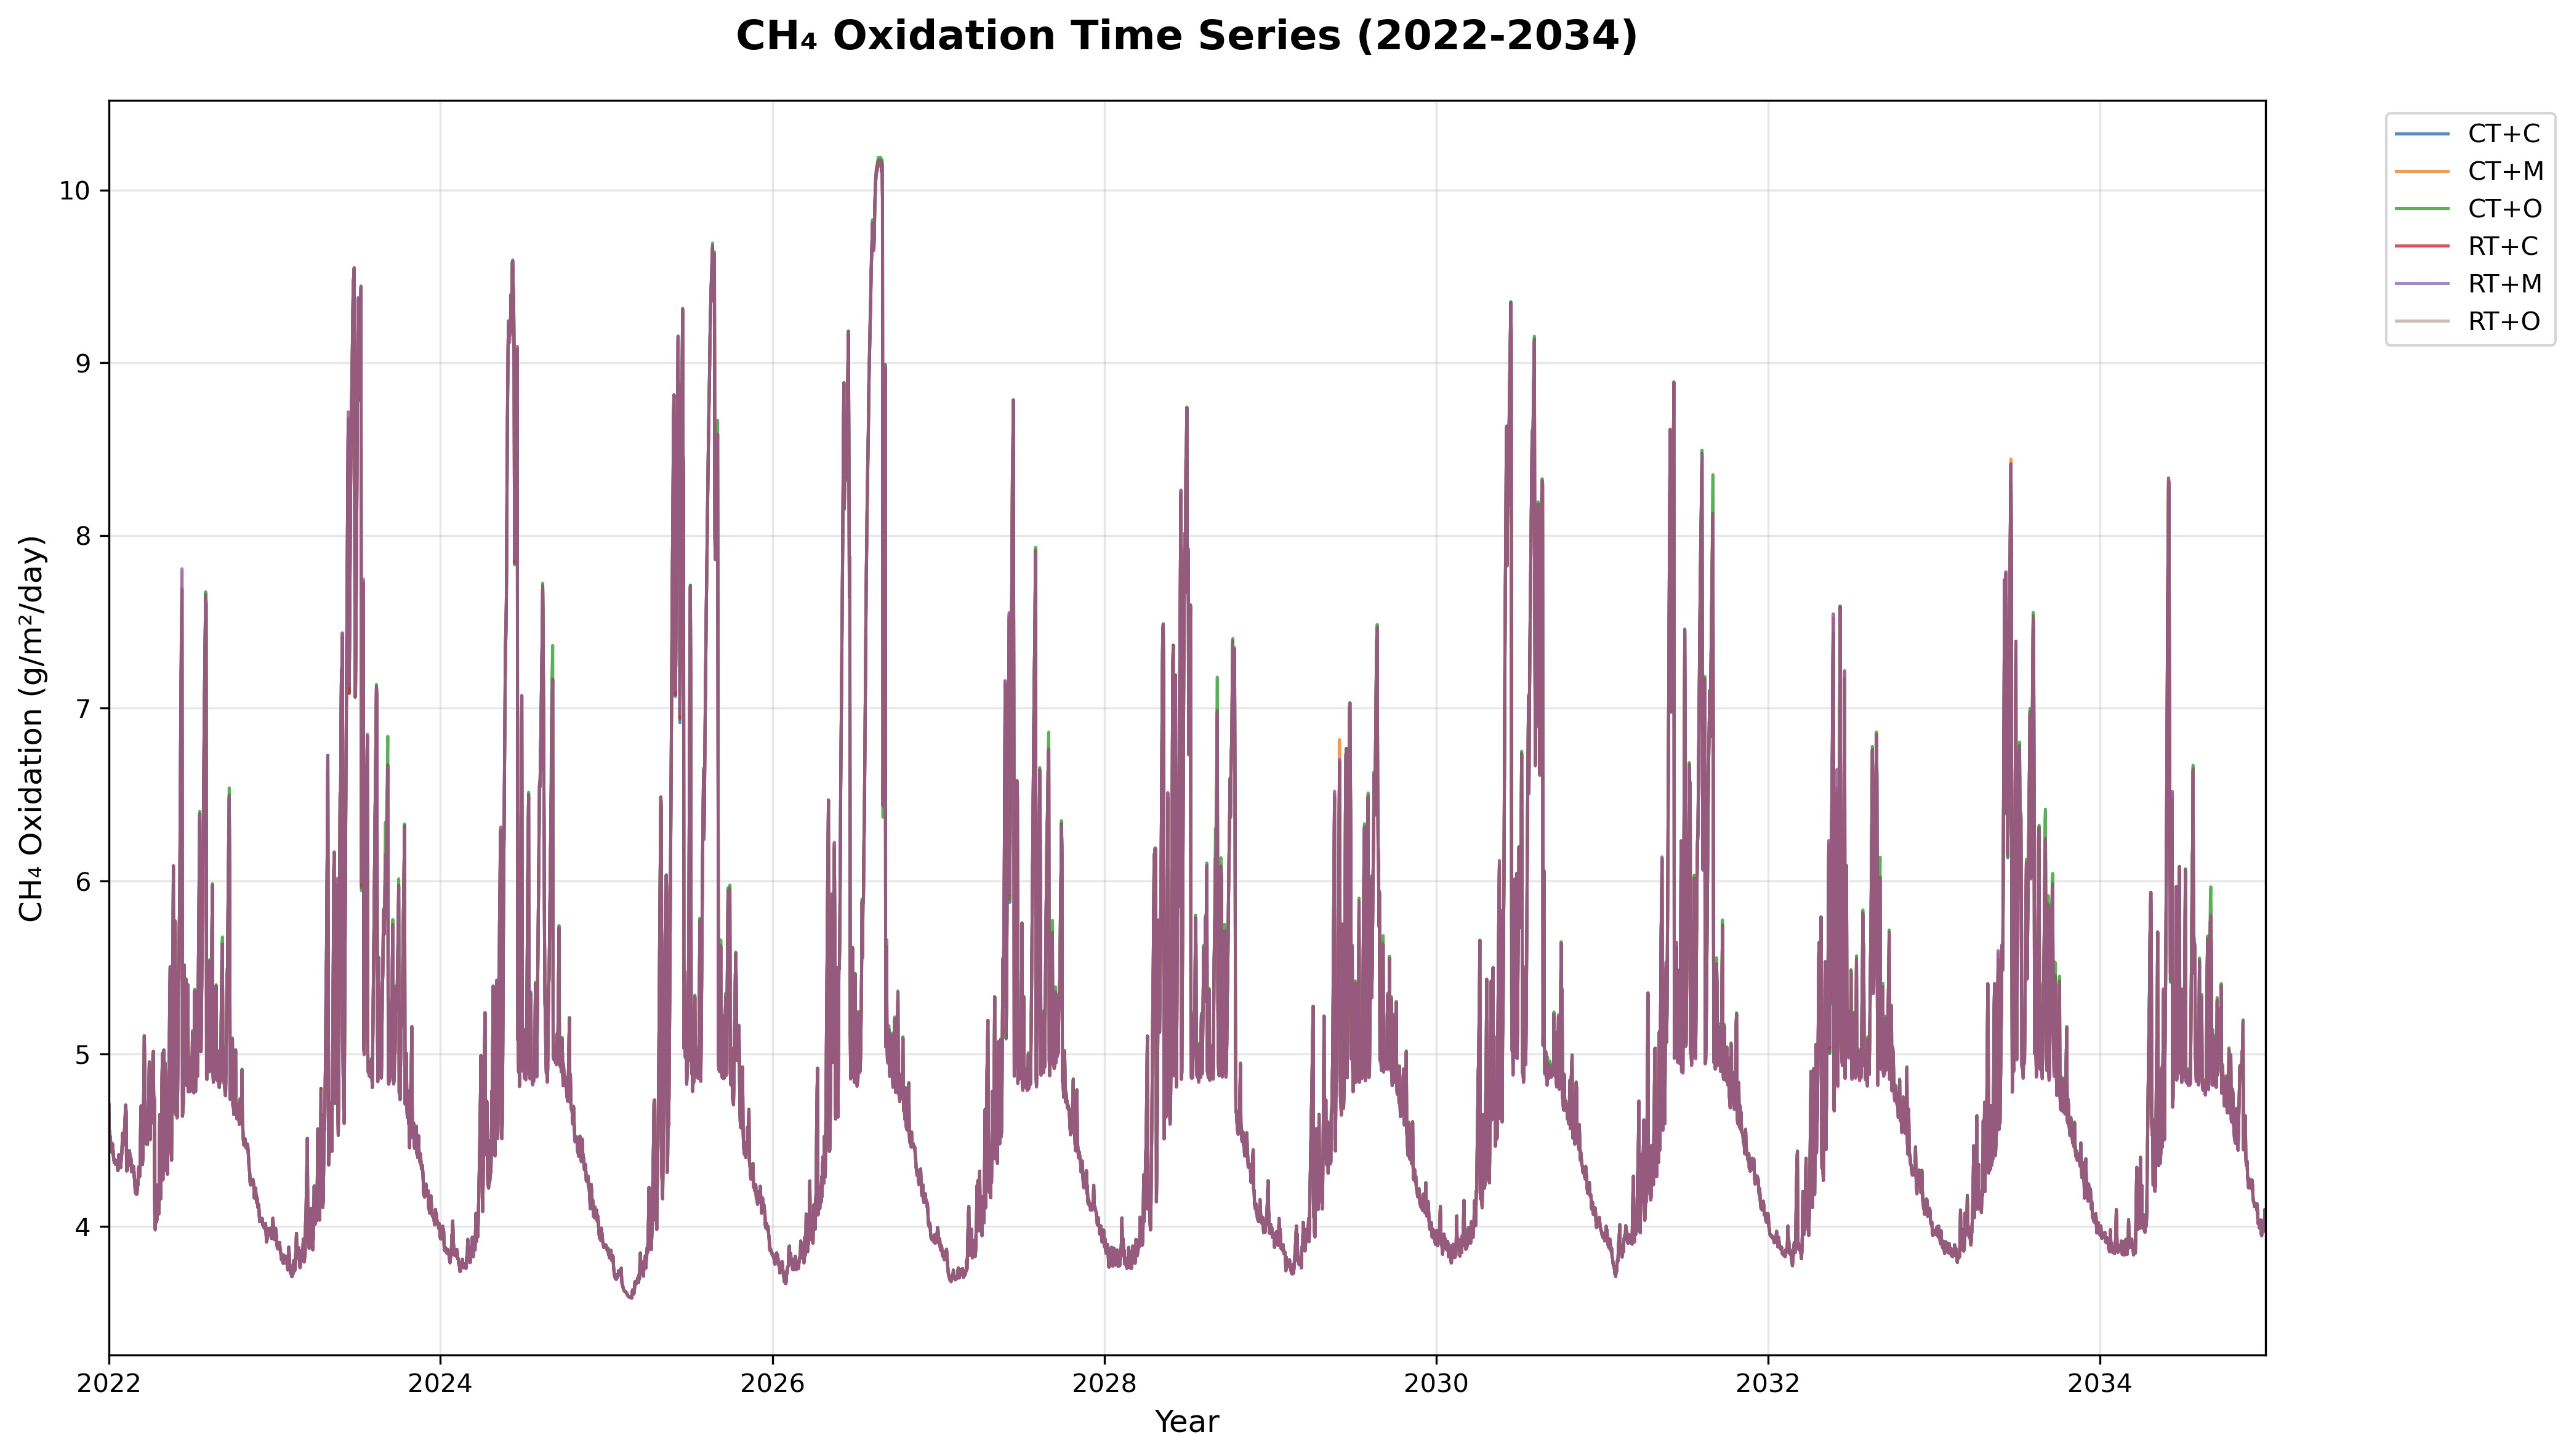
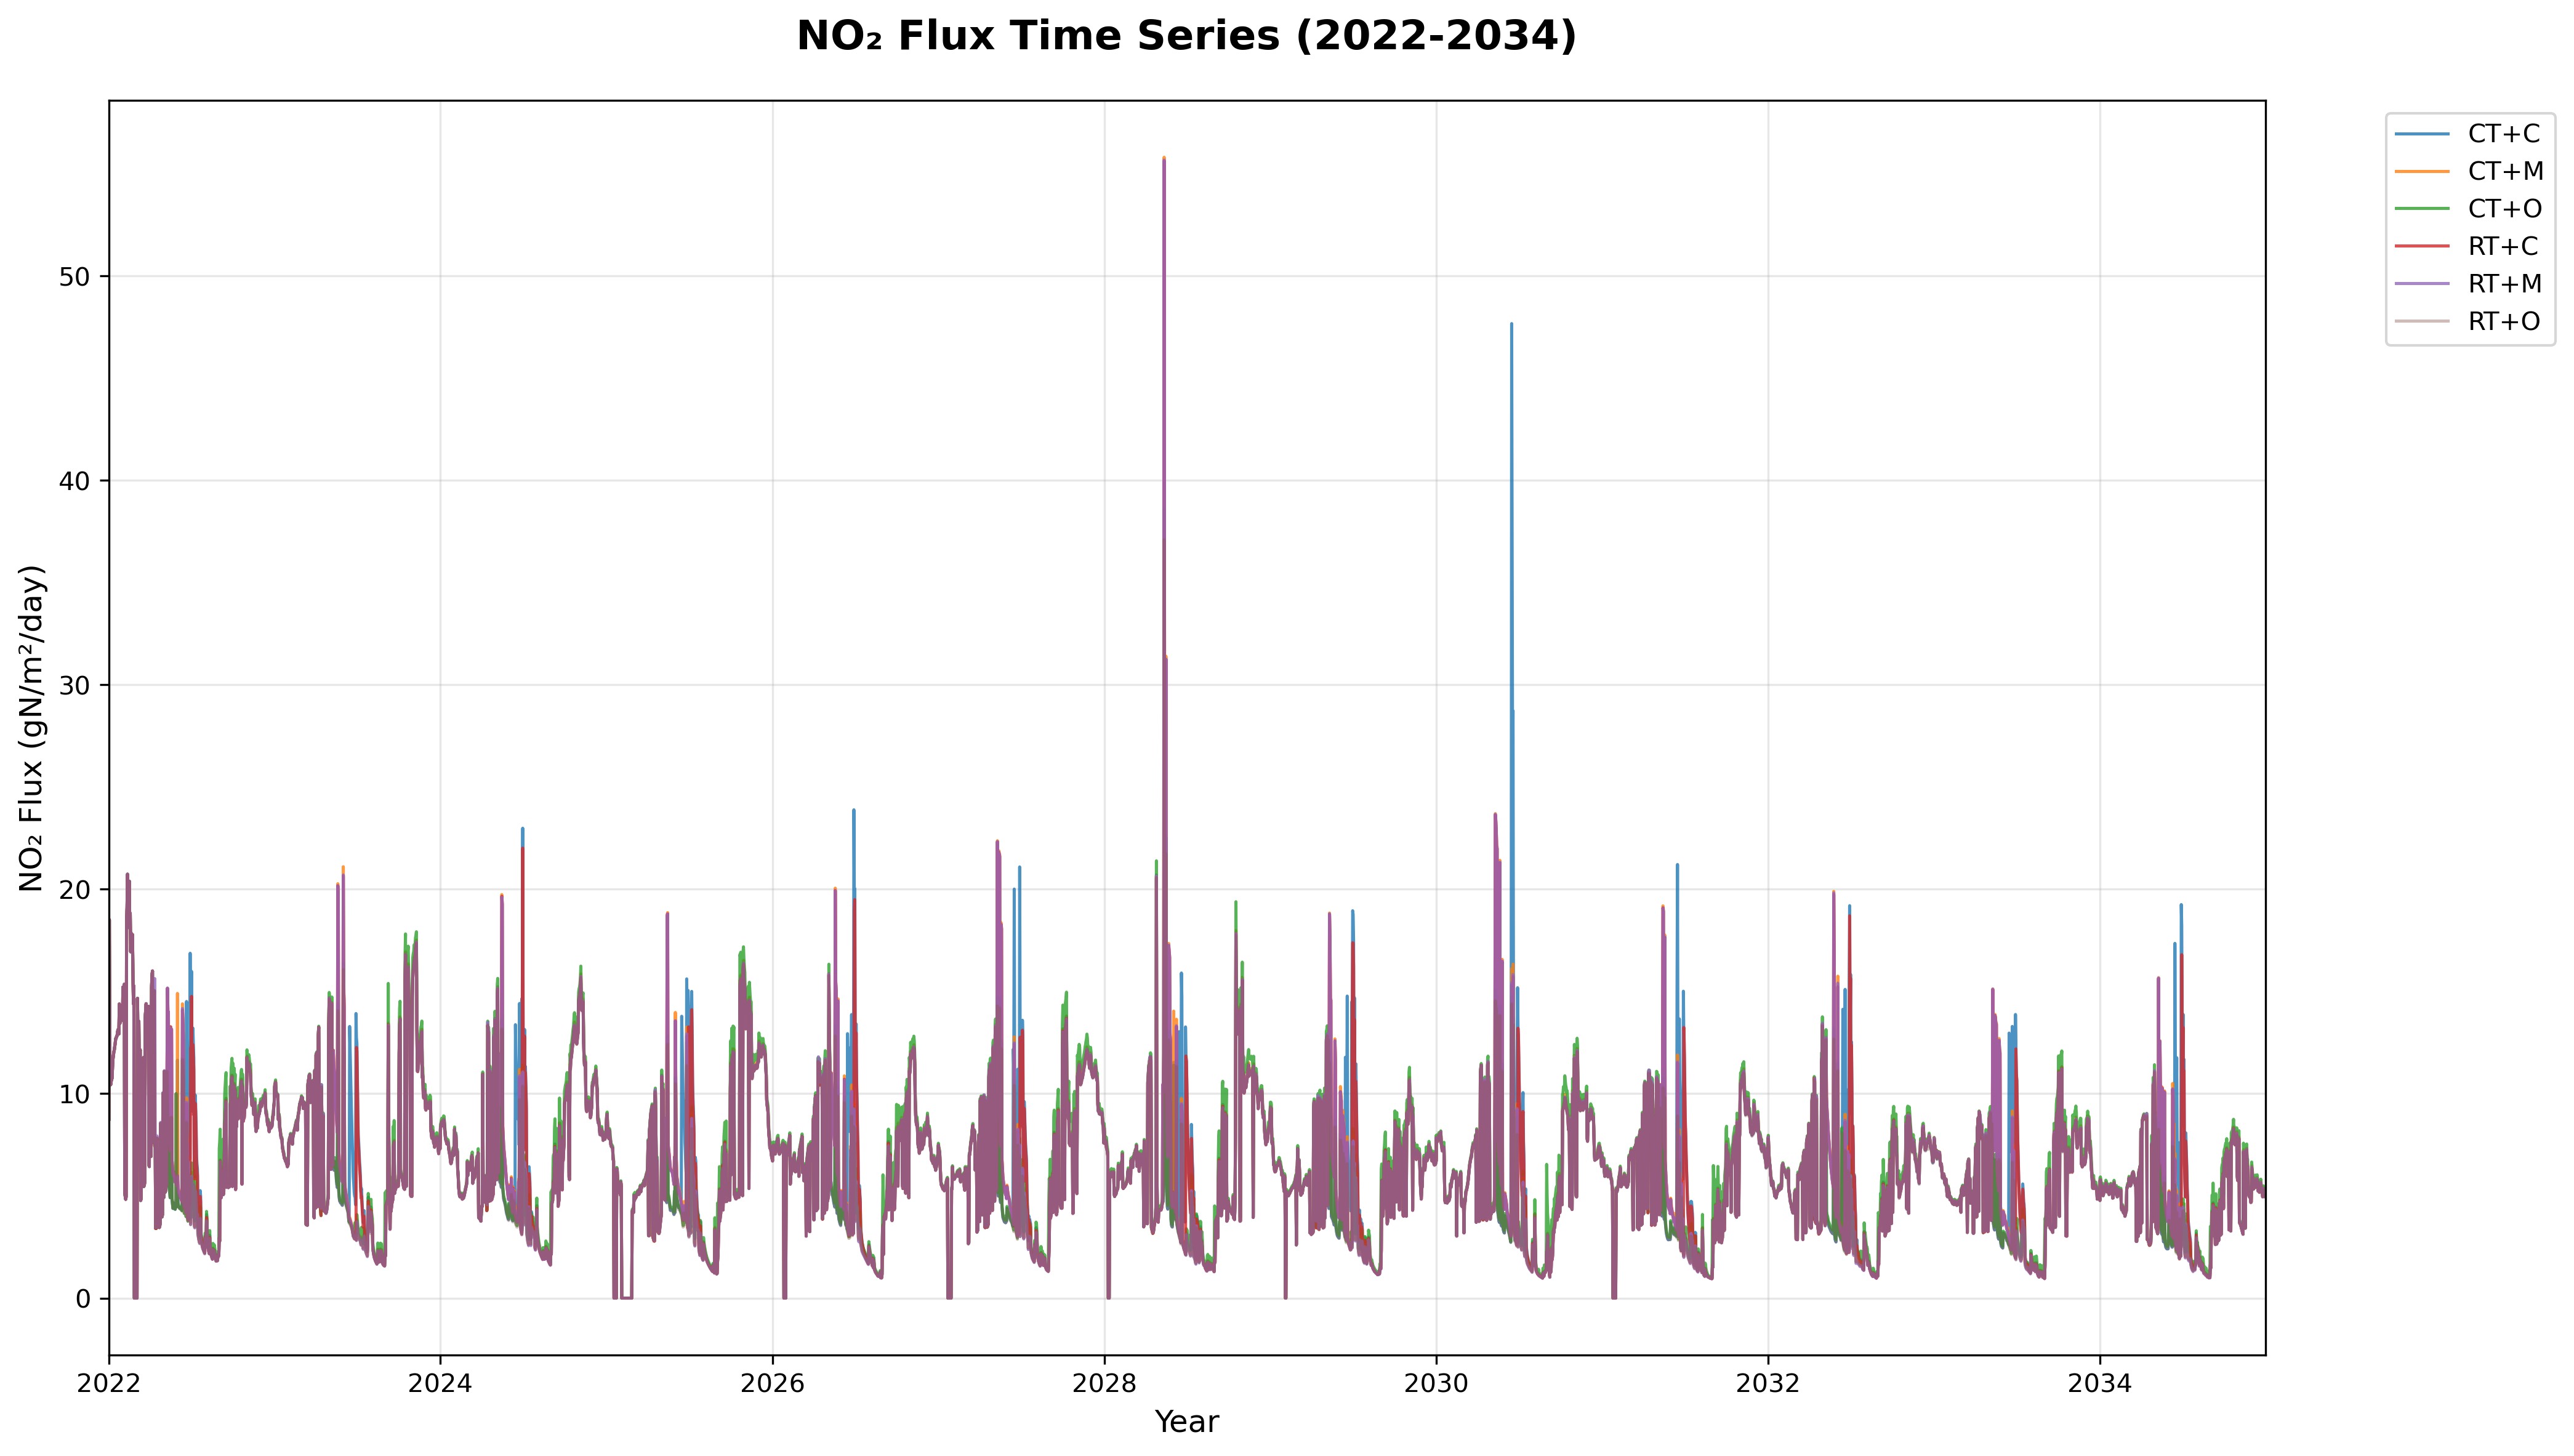
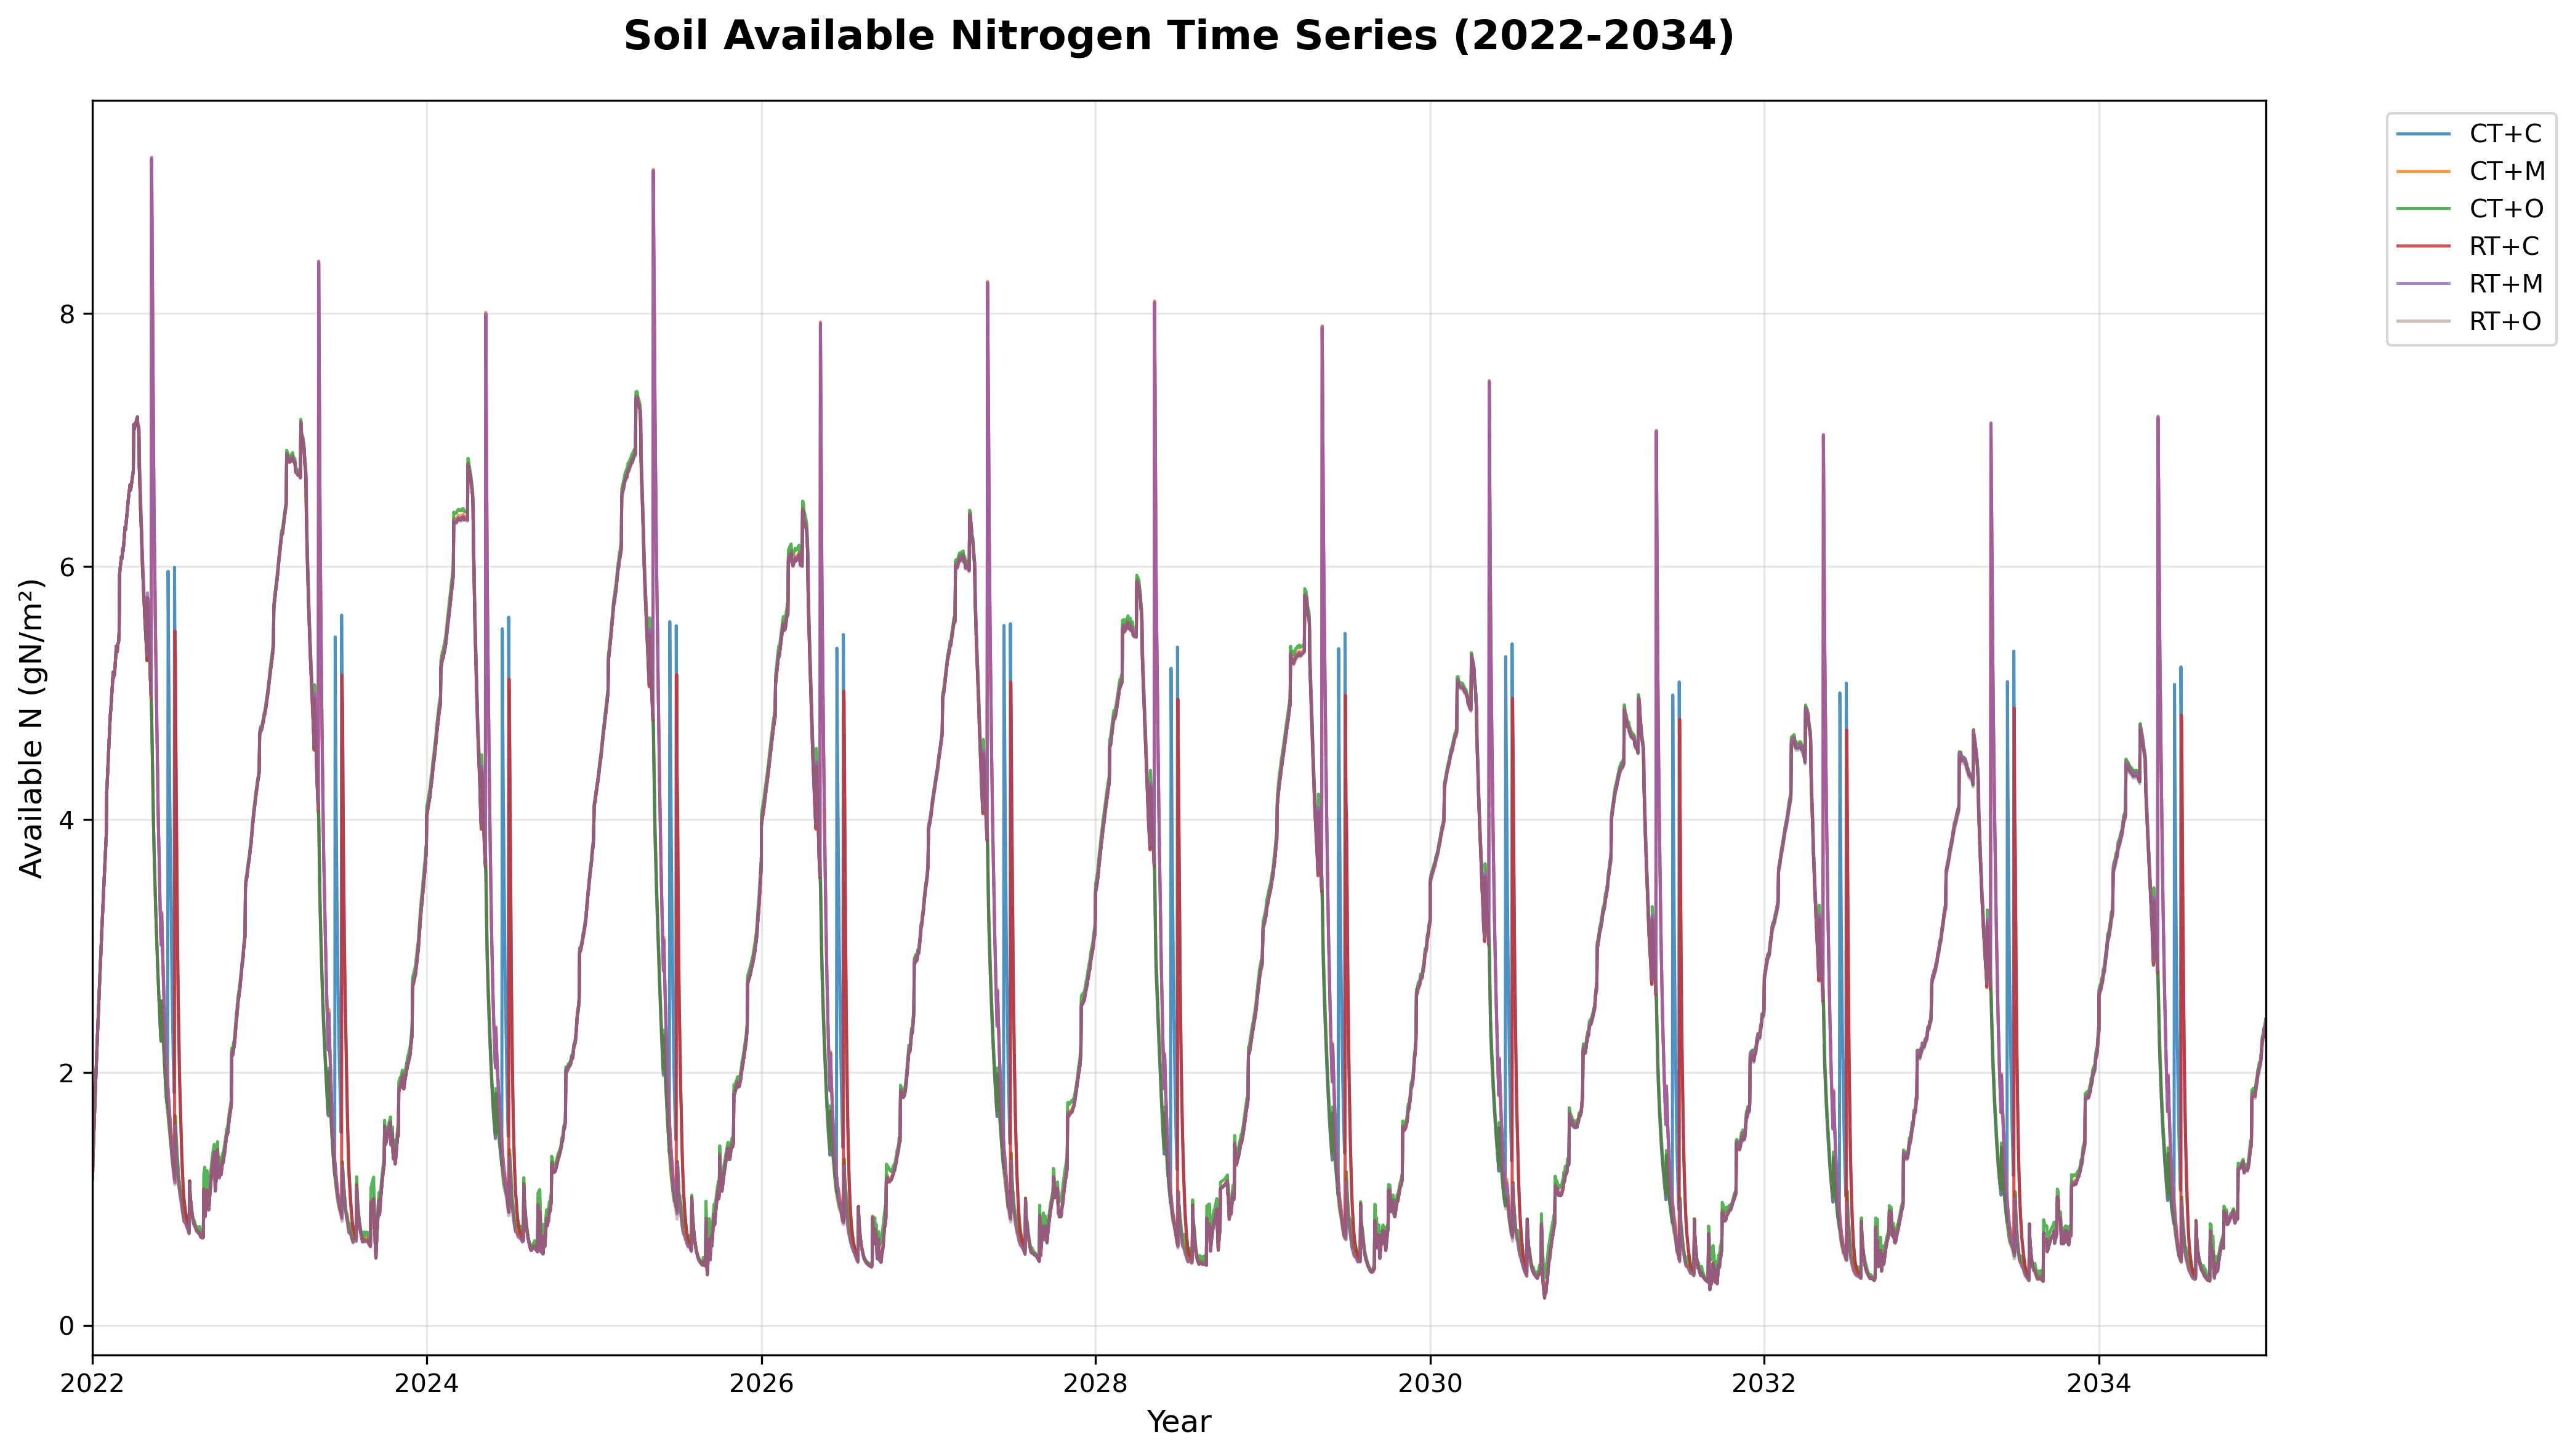
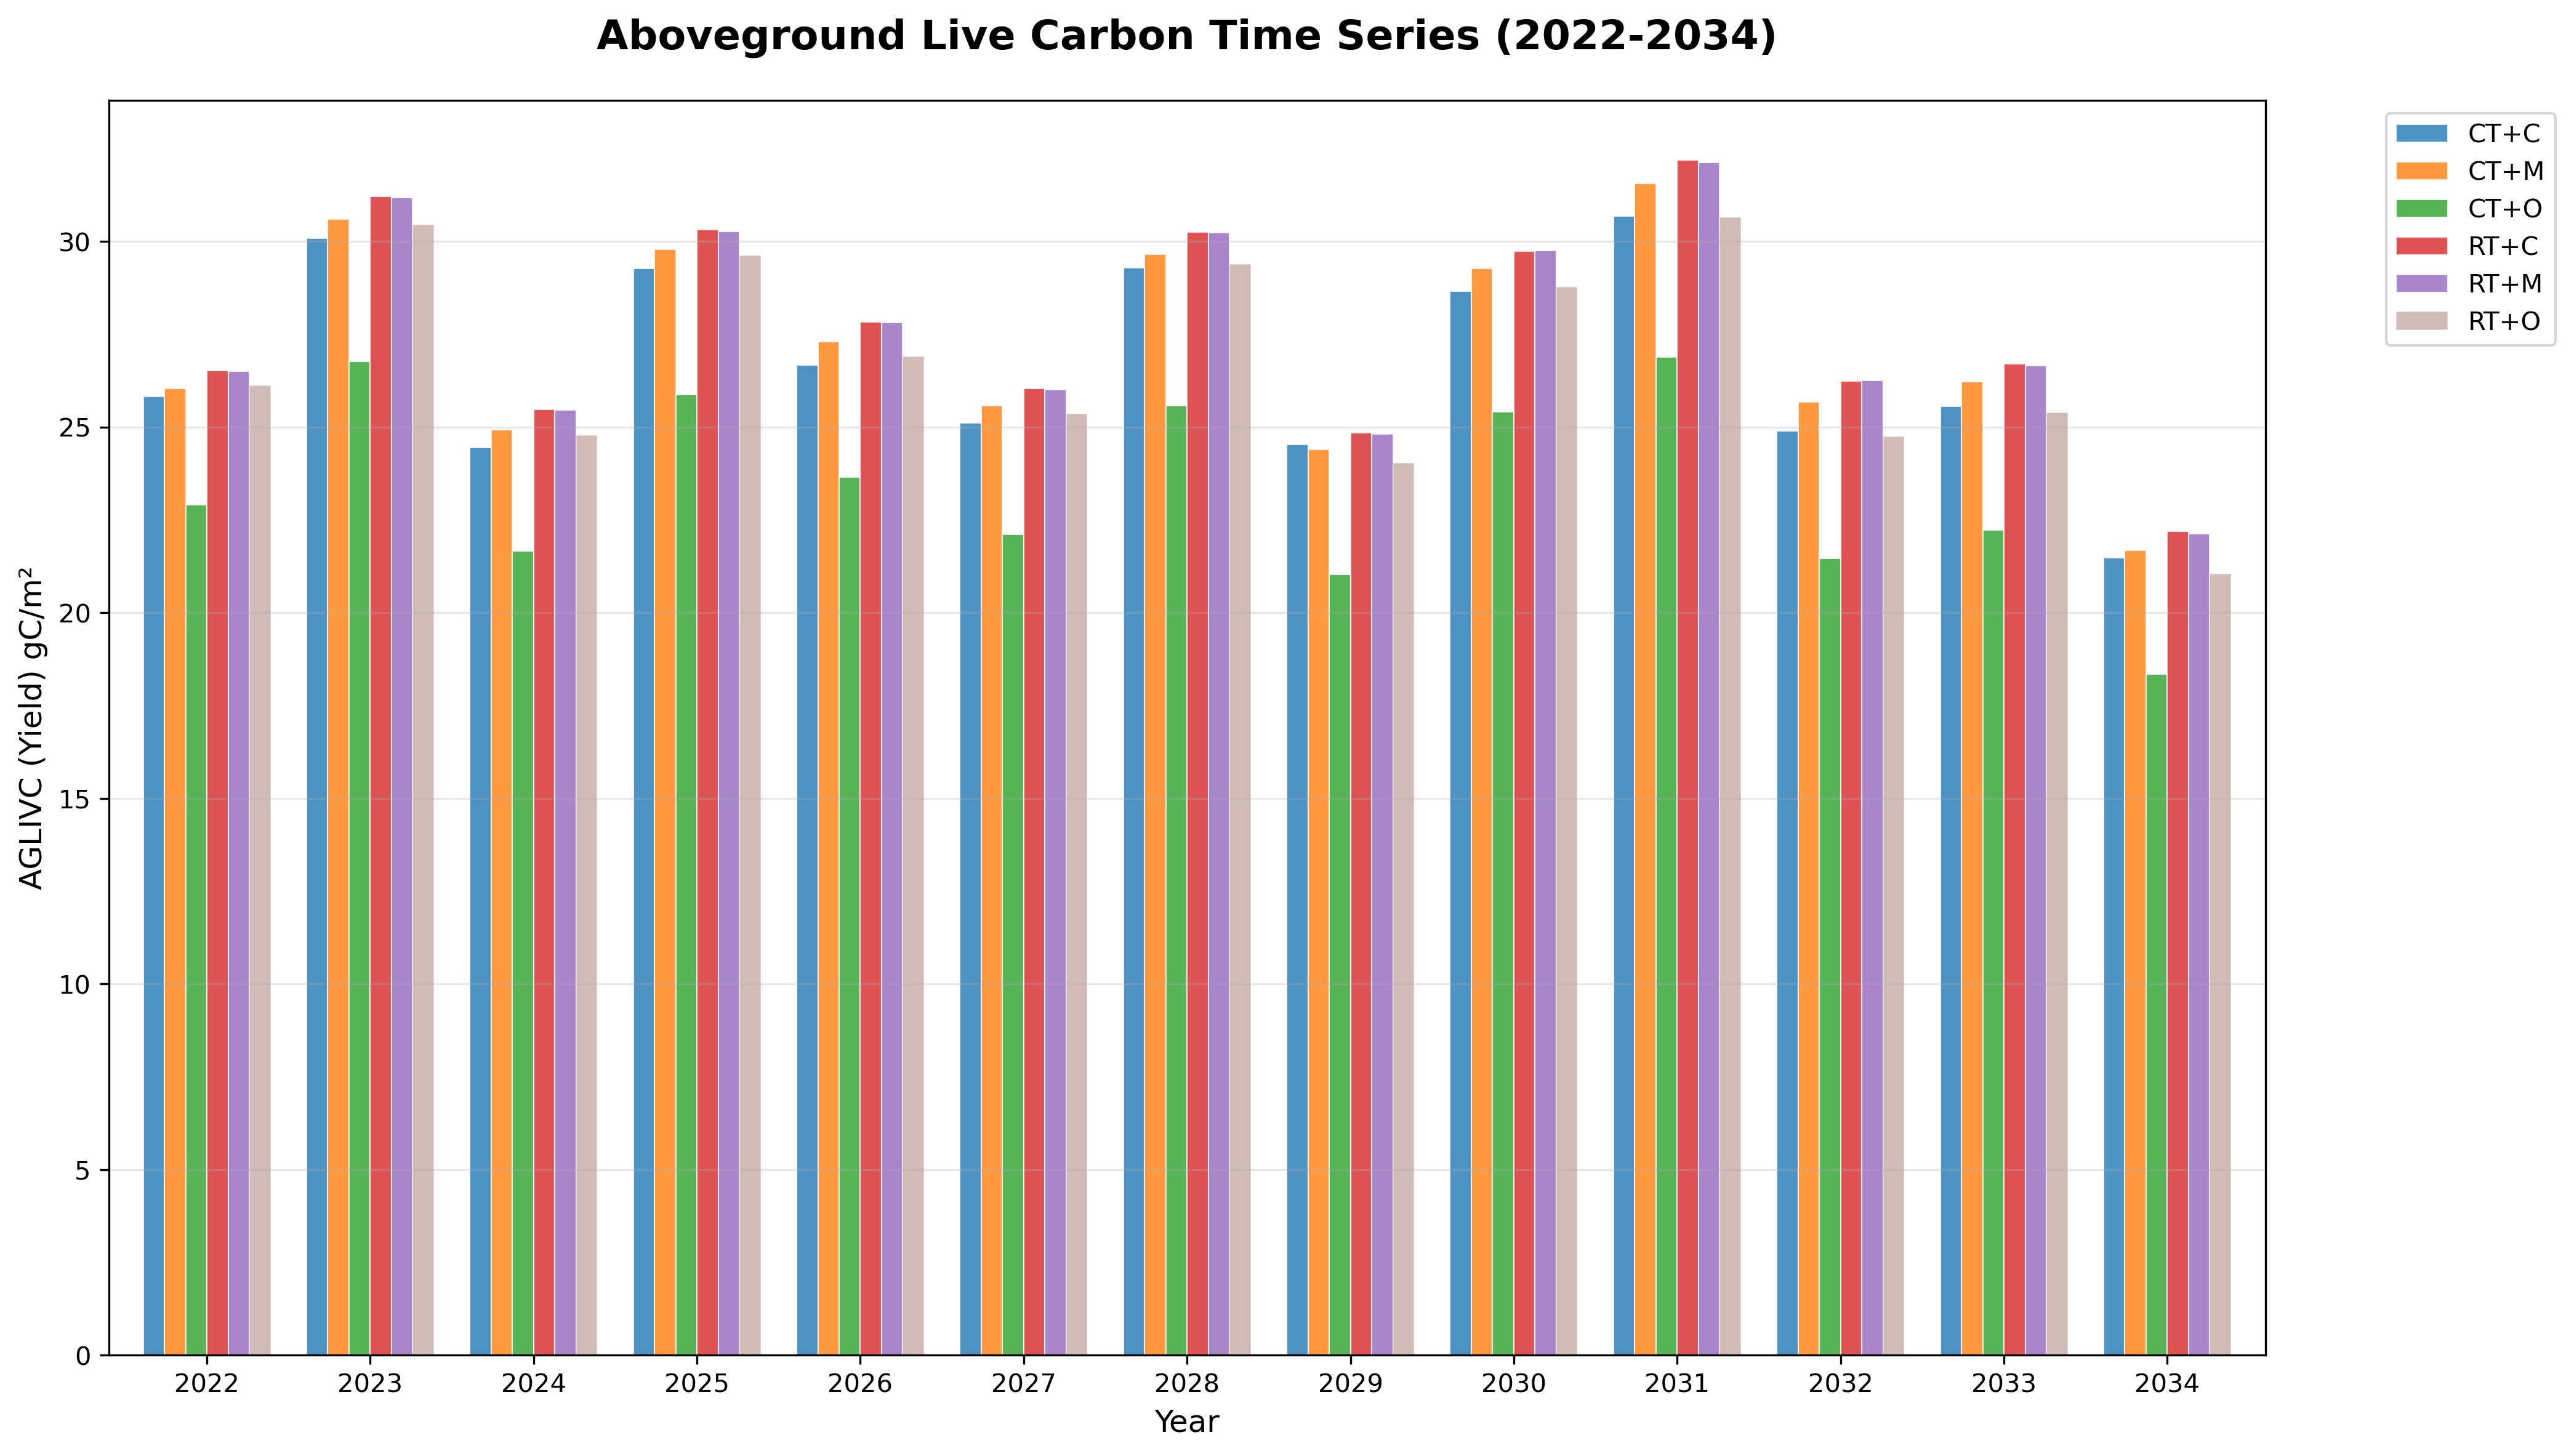
Future Projections (2022-2034)
🔮 Model Simulations: Long-term forecasts showing expected trends under continued conservation agriculture practices through 2034.
SOC Forecast
n=48Projected soil carbon accumulation through 2034
CO₂ Forecast
n=48Predicted carbon dioxide emissions trajectory
CH₄ Forecast
n=48Methane emissions projections
Soil Moisture Forecast
n=48Expected soil water content patterns
N₂O Forecast
n=48Future nitrous oxide emissions under conservation practices
Soil Nitrogen Forecast
n=48Long-term nitrogen availability projections
Yield Forecast
n=48Projected crop productivity trends
Uncertainty Analysis
Model Uncertainty Quantification
Sensitivity analysis showing the range of possible outcomes and confidence intervals for key soil and crop parameters.
Treatment Comparison & Key Findings
🌱 Soil Organic Carbon (SOC)
* Significant at p < 0.05 (Tukey HSD test)
💨 CH₄ Emissions
* Negative values indicate reduced emissions (good)
🌾 Crop Yield
* Based on 2-year average biomass
🏆 Overall Best Practice
RT + Mulch
Reduced Tillage with Organic Mulch
Comprehensive Methodology
📍 Site Characteristics
🇯🇵 Niigata Field, Japan
Location
Coastal Niigata, Japan
37°51'00"N, 138°56'00"E
Elevation: 7 m above sea level
Climate
Temperate maritime
Rainfall: ~2,500 mm/yr
Temp: 4.8-30.8°C
Soil Type
Andosol/Entisol
pH: 6.6-6.9
EC: 0.24-0.28 dS/m
Soil Texture
Well-drained sandy
80% sand, 15% silt, 5% clay
Baseline SOC: 2,695 ± 2 g C m⁻²
🇹🇬 Zio Field, Togo
Location
Agbelouve Research Station
6°27'N, 1°28'E
Elevation: 185 m
Climate
Tropical sub-humid
Rainfall: 1,200-1,500 mm/yr
Temp: 25-27°C
Soil Type
Plinthosol (WRB)
pH: 7.0
EC: 0.5 dS/m
Soil Texture
Clay-rich, high bulk density
Organic C: 5%
NPK: 20-25-20%
🧪 Experimental Design
2 ha
Total Area
25×25m
Plot Size
n=4
Replicates
Design: Randomized Complete Block Design (RCBD) with factorial arrangement
Treatments (6 total):
- CT+C: Conventional Tillage + Chemical fertilizer (NPK 15-15-15)
- CT+M: Conventional Tillage + Mulch (4 t ha⁻¹ crop residues)
- CT+O: Conventional Tillage + Organic fertilizer (8 t ha⁻¹ compost)
- RT+C: Reduced Tillage + Chemical fertilizer
- RT+M: Reduced Tillage + Mulch
- RT+O: Reduced Tillage + Organic fertilizer
⚙️ Measurement Equipment & Protocols
Soil Organic Carbon (SOC)
CN Elemental analyzer | Depth: 0-15 cm | Frequency: Monthly
Greenhouse Gas Emissions
LI-COR LI-7810 Trace Gas Analyzer | Closed chamber method | Frequency: Weekly
Soil Moisture (VSWC)
HydroSense II (Campbell Scientific) | 0-20 cm soil layer
Crop Yield
Manual harvest from 5m² sampling area per plot | Biomass dried at 70°C
💻 DayCent Model Configuration
Model Version: DayCent v4.5.7 (2023)
Calibration Period: 2022-2023 (18 months)
Validation Period: 2023-2024 (6 months)
Key Parameters Calibrated: Soil texture-specific decomposition rates, microbial efficiency, N mineralization, CH₄ oxidation
Performance Metrics: R² = 0.82-0.91 | RMSE < 0.25 for all variables
📊 Data Processing Workflow
- Raw data quality control and outlier detection using Tukey's method
- Gap filling using linear interpolation (max 7-day gaps)
- Statistical analysis: ANOVA, post-hoc Tukey HSD tests (α=0.05)
- Model calibration using Bayesian optimization (MCMC, 10,000 iterations)
- Uncertainty quantification via Monte Carlo simulation (n=1,000)
- Visualization using R (ggplot2) and Python (matplotlib/seaborn)
Data Citation & Access
How to Cite This Dataset
Banakinaou (2025). Conservation Agriculture Field Experiment Data: Soil Carbon and Greenhouse Gas Emissions. Niigata University. https://soiltoserve.com/data
License
CC BY 4.0
Creative Commons Attribution
Free to share and adapt with appropriate credit
DOI
10.xxxx/zenodo.xxxxxxx
Permanent identifier (pending)
Data Requests: For raw data files, analysis code, or collaboration inquiries, contact wiyao@soiltoserve.com
Related Resources
Explore more about this research through publications, field photos, and detailed analyses